group_project
Health Care Disparities - Primary Care Access Analysis
Overview

Analysis Results and Summary
Disparities in healthcare are an every day reality in the United States, so identifying ares for improvement is crucial for the health and well-being of communities. To answer the question “Are there are counties in the United States that will be underserved by primary care providers in the United States?”, a supervised machine learning model is the most appropriate choice. Our model, a logistic regression model using oversampling, produces an accuracy score of 99.9% and a r-squared score of 93.8%. This model will predict if a county is underserved or appropriately served 99.9% of the time and can predict new data points 93.8% of the time. This means that the model is slightly overfitted, meaning it is possible some new data points will not accurately be predicted.
Defining “Underserved” and “Appropriately Served”
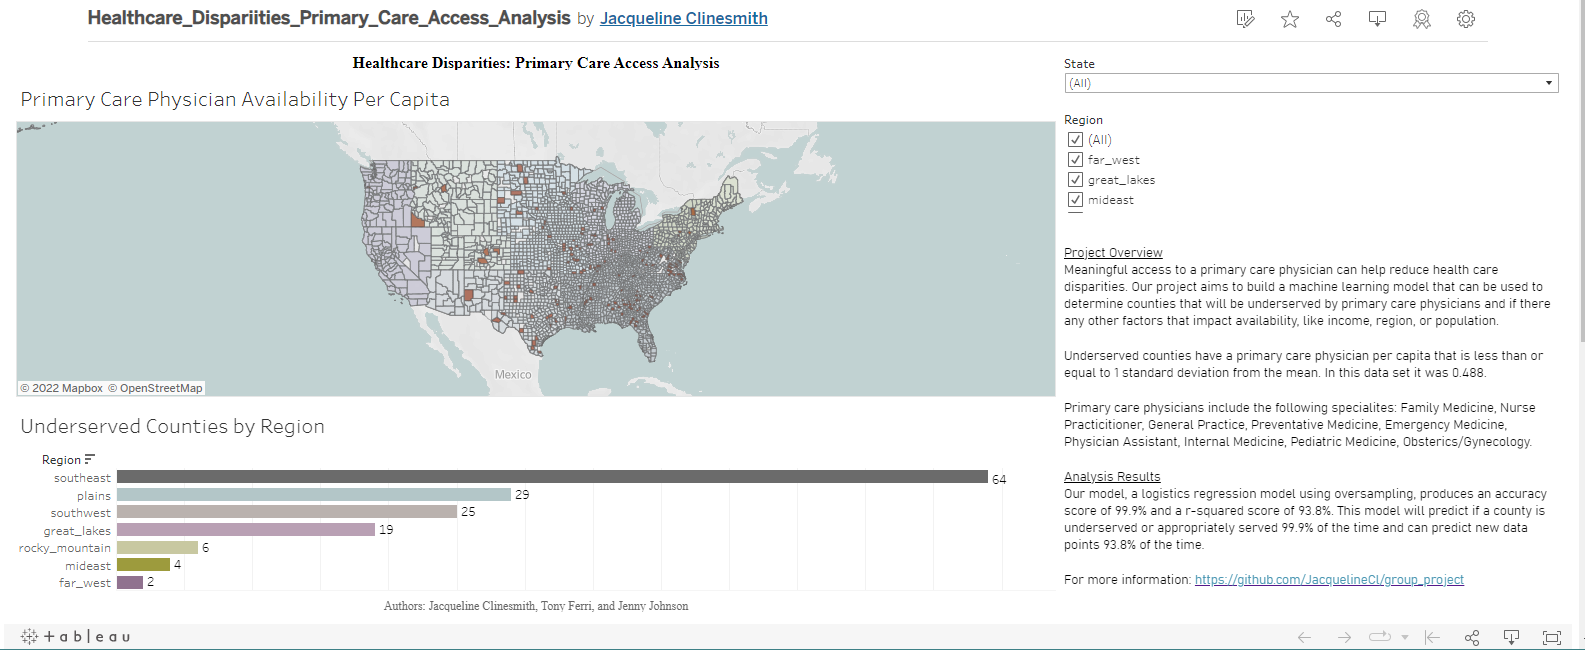
Physicians per capita is derived from dividing “pcp_count” by “population”. The mean for physicians per capita is 2.55, and the standard deviation is 2.06. It was decided that one standard deviation below the mean would be considered “underserved”. Therefore, any county with less than .488 physicians per capita will be considered underserved, while every county equal to or about .488 physicians per capita is considered “appropriately served”.


Defining a Primary Care Physician
A primary care physician is defined as someone who can perform basic medical tests to evaluate a person’s overall health. A primary care physician could specialize in family medicine, nurse practitioner, general practice, preventative medicine, emergency medicine, physician assistant, internal medicine, pediatric medicine, obstetrics, or gynecology.

Running the Model
Due to the data being split 19:1, the model must include oversampling and the removal of extraneous data. Before the logistic regression model included oversampling, the accuracy score was 96.2%, however, the r-squared score was -0.077%, meaning the model was an exceptionally poor fit and could not predict new data points with accuracy. Hyper tuning using SMOTE (Synthetic Minority Oversampling Technique) random oversampling and SMOTEENN (oversampling using SMOTE and cleaning using Edited Nearest Neighbor) using combination sampling does not improve the accuracy score or r-squared score of the model (both remain the same), and undersampling using random undersampling or cluster centroids undersampling lowers the accuracy score and drastically lowers the r-squared score, meaning the model is no longer a good fit and can no longer accurately predict new data. For this reason, undersampling the data should be avoided.
According to the data, any county with 0.488 primary care physicians per capita or less is “underserved”. Out of 3,092 counties, 148 are underserved, or ~5% of all counties, while 2881 counties, or ~95% of counties are appropriately served. While having 95% of the population adequately served is good, 5% of Americans being underserved means over 17 million Americans do not have access to a primary care physician.
Solutions to Primary Care Disparities
Solutions to primary care physician disparities might include: increasing utilization of virtual healthcare meetings (telehealth), providing loans to physicians to open new clinics, address primary care physician shortages by increasing funding for medical students to attend medical school, and empowering registered nurses legally and monetarily to provide care similar to a primary care physician.
Machine Learning Model
Data Preprocessing
Our three data sources were cleaned, standardizing the data, making sure all rows were named appropriately, removing any rows with null values and any duplicate rows. Once the data sources were merged and all rows created, the rows for each state and each region were dropped, as the data was irrelevant to the machine learning model. The pcp_per_capita, pop_density, per_capita_income were removed for the same reason, and pcp_per_capita_bins was removed as it is the target feature.
Engineering and Selection of Model
- Supervised Machine Learning: Logistic Regression
- We have a question we want to answer, therefore, supervised machine learning is the appropriate choice for this analysis. Logistic Regression will separate the data into two categories, counties that will be underserved by primary care physicians, and counties that will be appropriately served by primary care physicians.
Training and Testing Split
The balance of our target values were 2881 to 148, so oversampling is used to improve this.


Benefits and Limitations
The benefits of our model is its high accuracy score. A high accuracy score means the model overall is working the way it’s intended to and predicting data accurately almost 100% of the time. A limitation is that the r-squared score is on the cusp of being overfit, meaning there’s the possibility that not all NEW data will accurately predicted. Another limitation is that the more data that is added and more estimators used, the slower the model becomes.
Changes in Model and Hyper Tuning
Originally, our model did not use oversampling, so the r-squared score was -.077, meaning there was no fit at all. By adding oversampling, this corrected the issue. Hyper tuning using SMOTE and SMOTEENN did not increase the accuracy or r-squared score of the model, however, it was discovered that undersampling greatly decreased both the accuracy and the r-squared score.
Confusion Matrix, Accuracy Score, and R-squared Score
The confusion matrix is as follows:

For this model, there were 34 true positives, 0 false positives, 2 false negatives, and 722 true negatives.
-
Accuracy score: 99.9%
-
R-squared score: 93.8%
-
Precision score: 100% (quality of a positive prediction made by the model)
-
Sensitivity(recall): 94.4% (can predict true positives)
-
F1 score: 97.1% (balance between the precision and recall)


Tableau Dashboard
A tableau dashboard was created to visualize the data and allow for easy filtering by region and state.

Presentation
A presentation further outlines our approach, analysis, and results.
Tools Used
Jupyter Notebook, Python, Pandas, Matplotlib, NumPy, Pathlib, Sklearn.metrics, Tableau, PostgreSQL, and Quick DBD
Conceptual Entity Relationship Diagram
ERD showing relationships between tabular data sources

Database
PostgreSQL 11 used to house and query data


Data Sources

References
https://www.census.gov/popclock/
https://www.ncsl.org/research/health/increasing-access-to-health-care-through-telehealth.aspx
https://www.ncbi.nlm.nih.gov/pmc/articles/PMC6367893/
https://phdproject.org/educational-funding/
https://www.ruralhealthinfo.org/funding/3543
Contributors
Jacqueline Clinesmith
https://www.linkedin.com/in/jacqueline-clinesmith-883014a0/
Jennifer (Jenny) Johnson
https://www.linkedin.com/in/jennifer-johnson-a32b88219/
Tony Ferri
https://www.linkedin.com/in/tony-ferri-7442474/